Parent Functions: Definition, Types, and Examples
Observe how most functions’ graphs follow similar patterns and look alike when you work with their graphs. As a result, functions sharing the same degree will follow the same curve and share the same parent functions.
A family of functions is represented by the simplest form of the parent function.
This definition perfectly summarizes what parent functions are. The use of parent functions facilitates the graphing of functions found in the same family. In this article, we will:
- Review all the unique parent functions (you may have already encountered some).
- Learn how to identify the parent function that a function belongs to.
We can better understand functions if we can identify and graph their parent functions, so what are we waiting for?
What is a parent function?
Let’s start by learning what parent functions are and how their families of functions are affected by their properties so we understand how important it is to master the different types of parent functions.
Parent function definition
The parent function is the simplest form of a given family of functions. In mathematics, a family of functions refers to a collection of functions that have the same highest degree and, therefore, their graphs also have the same shape.
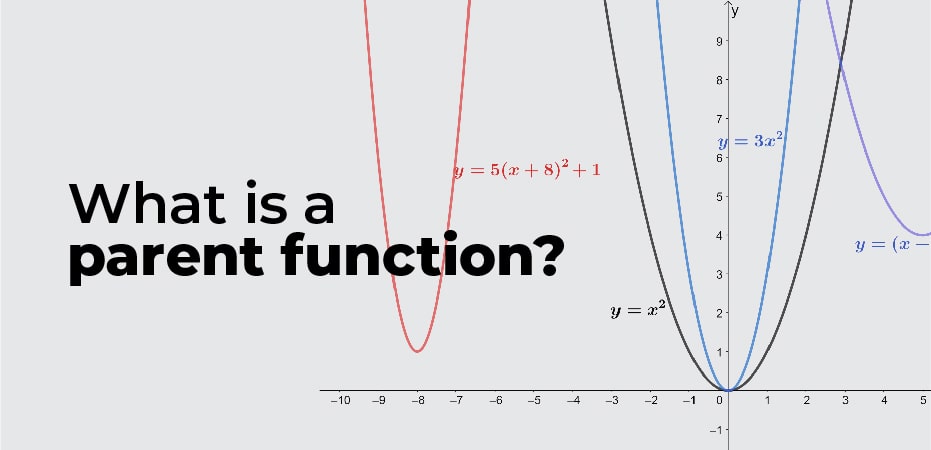
We call a parabola a U-shaped graph. In the graphs above, you can see four parabolas. We can group them as one family of functions since they all have the same highest degree of two and the same shape. Can you guess which family they belong to?
These four are whole quadratic functions, and their simplest form would be y = x2. Therefore, the parent function for this family is y = x2.
Because parent functions are the simplest form of a given group of functions, they are able to give you an idea of how a given function from the same family might look.
What are the different types of parent functions?
Now is the time to refresh our knowledge of functions and learn about new ones. We have seen that becoming familiar with parent functions will enable us to better understand and graph functions.
Let’s start with those we might already know from past experience.
Polynomials of increasing degree are involved in the first four parent functions. We can observe how their graphs behave and note the domain and range of their respective parent functions.
Constant Functions
Constant functions are defined by their respective constants. The graph of all constant functions will consist of a horizontal line and will contain only a constant as its term.
A constant function will have all real numbers as its domain and y = c as its range. They also all have a y-intercept at (0, c).
Constant functions can be compared to an object’s motion while at rest.
Linear Functions
Linear functions have x as the term including the highest degree and a general form of y = a + bx. There is always a smooth straight line plotted for linear functions.
The parent function of linear functions is y = x, and it moves into the origin. Each linear function has a domain and range of real numbers.
Relationships between two objects that are linearly proportional to each other are represented by these functions.
Quadratic Functions
Quadratic functions are those with 2 as their highest degree. All quadratic functions have a parabola as their graph. As explained in the previous section, quadratic functions have y = x2 as their parent function.
The vertex of the parent function y = x2 lies at the origin. It too has a domain of all real numbers and a range of [0, ∞). Observe that this function improves when x is positive and decreases while x is negative.
A great application of quadratic functions is projectile motion. We can see an object’s projectile motion by graphing the quadratic function that represents it.
Cubic Functions
Let’s go on to the parent function of polynomials with 3 as its highest degree. Cubic functions give a parent function of y = x3. This function is growing throughout its domain.
As with the two previous parent functions, the graph of y = x3 also moves through the origin. Its domain and range are both (-∞, ∞) or every real numbers as well.
Absolute Value Functions
The parent function of absolute value functions is y = |x|. Graphs of absolute value functions should display V shapes, as illustrated by the parent function’s graph.
The vertex of y = |x| is located at the origin as well. Since it continues on both ends of the x-axis, y= |x| has a domain at (-∞, ∞). Absolute values can nevermore be negative, so the parent function has a range of [0, ∞).
We utilize absolute value functions to highlight that a function’s value must always be positive.
Radical Functions
The two most generally used radical functions are the square root and cube root functions.
The parent function of a square root function is y = √x. Its graph shows that both its x and y values can nevermore be negative.
This implies that the domain and range of y = √x are both [0, ∞). The starting point or vertex of the parent function is also seen at the origin. The parent function y = √x is also rising throughout its domain.
Our next step will be to examine cube root functions’ parent function. Similar to the square root function, its parent function is shown as y = ∛x.
The graph reveals that the parent function has a domain and range of (-∞, ∞). We can also see that y = ∛x is growing throughout its domain.
Exponential Functions
Exponential functions are functions that have algebraic expressions in their exponent form. Their parent function can be represented as y = bx, where b can be any nonzero constant. The parent function graph, y = ex, and from it, we can see that it will never be equal to 0.
And when x = 0, y passes through the y-axis at y = 1. We can also understand that the parent function is nevermore found below the y-axis, so its range is (0, ∞). The parent function can, however, be used for all real numbers. It can also be seen that its domain increases from top to bottom.
Modeling population growth and compound interest are two of the most common applications of exponential functions.
Logarithmic Functions
Inverse functions of exponential functions are logarithmic functions. Its parent function can be represented as y = logb x, where b is a nonzero positive constant. Let’s examine the graph when b = 2.
Like the exponential function, we can observe that x can never be less than or equal to zero for y = log2x. Hence, its domain is (0,∞). Its range, however, contains all real numbers. We can also notice that this function is increasing throughout its domain.
We use logarithmic functions to model natural phenomena so as an earthquake’s magnitude. In physics and chemistry, it is also used when calculating half-life decay rates.
Reciprocal Functions
A reciprocal function contains a constant numerator and x as its denominator. Its parent function is y = 1/x.
X and Y cannot be equal to zero, as can be seen from its graph. This implies that its domain and range are (-∞, 0) U (0, ∞). This implies that the function decreases over its range.
These eight parent functions are some of the more commonly used and discussed functions throughout our voyage with functions and graphs.
By creating a table containing all the properties of the parent functions, you can summarize what you’ve learned so far.
How to find the parent function?
If we’re given a function or its graph, how can we identify its parent function? Identifying which of the parent graphs we discussed matches the given one can be accomplished by remembering each function’s important properties.
The following guide questions may be helpful:
- What is the function’s highest degree?
- Does it have a square root or a cube root?
- Is it a denominator or an exponent function?
- Is the function’s graph decreasing or increasing?
- What is the function’s domain or range?
We can identify the parent function if we can answer some of these questions by inspection.
Let’s try f(x) = 5(x – 1)2. We can see that the highest degree of f(x) is 2, so we understand that this function is a quadratic function. Therefore, its parent function is y = x2.
How about graphing f(x) as well as confirming our answer?
From the graph, we can understand that it forms a parabola, confirming that its parent function is y = x2.